Introduction
“Without mathematics there is no art,” said Luca Pacioli, a contemporary of Da Vinci.
Working through the galley division algorithm made me think about the connection between art and math throughout history. I was curious about the earliest connections – how early did people first begin to see beauty in geometric figures and the patterns found in nature? The Golden Ratio, often mentioned as the earliest convergence between art and math, was considered “aesthetically pleasing”. The pyramids and Parthenon rely on special ratios and math in their construction. Da Vinci famously studied the proportionality in the human body and relied on mathematics throughout his artwork, even using his art to solve a mathematical problem that had burdened the great thinkers of his day. Fractals were a fascinating discovery of infinite repetition that both created beautiful figures and contributed a great deal to modern computing and accurate global coast mapping.
Galley, or “Scratch”, Division
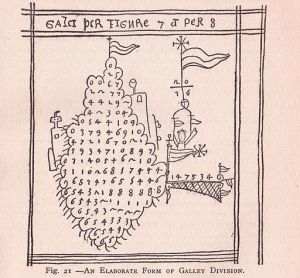
This is an instance of beautifully simple algorithm that solves a mathematical problem with two results: the quotient and remainder from a long division problem, and a cleverly drawn shape that resembles a boat. This method of long division was actually the most widely preferred for solving long division for seventeen centuries, popular until around 1600 AD. The process (not to its entire solution) is displayed in the image below, alongside a more artful example from “The Science-History of the Universe” (Francis Rolt-Wheeler 1910). The end result is the quotient displayed to the right of the original dividend, with the remainder shown as the cascading digits above the dividend (those without a dash through them in the modern example)

“Galley Method3”. Licensed by Soporific under Creative Commons Attribution-Share Alike 3.0 via Wikimedia Commons.

Galley division by a 16th century Venetian monk, published in the 1910 book The Science-History of the Universe by Francis Rolt-Wheeler. Image: Public domain, via Wikimedia Commons.
The Pyramids and the Parthenon – Egyptian triangle and golden ratio found in its base, Parthenon and golden rectangle found above its pillars
While there isn’t evidence of the Egyptians intentionally using Phi or Pi when designing their structures, both numbers are seen in the pyramids’ dimensions with nearly perfect accuracy. Mock pyramids based on both Phi (the golden ratio) and pi, vary from the actual dimensions of the pyramids by very little, on the order of inches. In terms of Phi, this comes down to 1.4 inches, which can be attributed to rounding differences or differences in the estimated dimensions of the pyramids with their covering stones (the pyramids now are missing their smooth outer shells, so what we see today is the structural core). In terms of Pi, the difference between a pyramid based on Pi and the estimated dimensions of the completed pyramids differ by 5.5 inches. So while the methods by which the Egyptians arrived at the dimensions they used, given that the pyramids were built to within 1/15 of a degree of true north, it is doubtful that the presence of Phi and Pi are pure coincidence.
As with the pyramids, there is doubt about whether there was conscious use of the golden ratio in the construction of the Parthenon in Greece. The Parthenon was finished in 438 BC, and the first documented awareness by the Greeks of the golden ratio was not until 300 BC in Euclid’s Elements. The golden rectangle can be found in its construction, however there is debate that this may be more coincidental or a case of modern mathematical knowledge informing interpretation. When the spiral of the golden ratio is laid over a photo taken of the front face of the Parthenon without perspective distortion, one needs to assume that the bottom of the spiral will rest on the second (not the bottom) step of the structure, however the spiral is perfectly represented in the area directly over the columns.
da Vinci the Vitruvian man
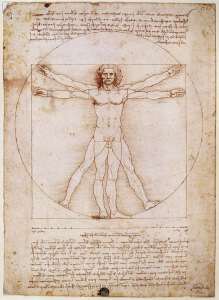
Da Vinci used art to discover a close approximate solution to one of the greatest mathematical problems of his day, squaring the circle. Squaring the circle is the problem of generating a circle and a square with the same area, given only a compass and straightedge to draw both. He did so through the Vitruvian Man, with 99.8% accuracy (further accuracy even today isn’t possible because of the irrational nature of Pi), and created one of the most iconic images of the Renaissance at the same time. The two shapes, the square and the circle, are drawn simply by changing the positions of the man’s arms and legs, generating each shape with a (nearly) equal area to the other.
Credit is due to Marcus Vetruvius , a Roman architect of the first century BC, who recognized two interesting facts: he used the navel as the center point to draw the circle using a compass, and recognized that a man’s arm span and his height almost perfectly coincide, drawing the square. Leonardo was responsible for bringing together these two ideas to solve the problem of squaring the circle. This idea interestingly came at the same time as a resurgence in the philosophy called NeoPlatonism, which places beings in a hierarchy with God at the top, the devil and animals at the bottom, and man directly in the middle, just as the Vetruvian Man formed the center of solving a seemingly irreconcilable problem in mathematics
Fractals
As a computer science major, fractals are one of the most interesting examples of when math and art have crossed paths. The history of fractals begins with a name familiar to anyone who’s been through Calculus – Gottfried Liebniz – who considered the concept of recursive self-similarity. His musings languished as just that for centuries, partly because mathematicians of his time were resistant to unfamiliar, uncomfortable concepts, going so far as to call them “mathematical monsters”. Progress was made in the early 20th century by Helge von Koch, who drew the familiar Koch Snowflake, a simple and yet incredibly complex definition for self-similar geometric figures. The term we use today was not coined until the 1960s, when Benoit Mandelbrot, working at IBM where he had access to some of the earliest computers, researched objects typically considered “messy” and hard to define – things like clouds and shorelines that were considered utterly random. His research proved they could be reduced to self-similar patterns, and this led to more accurate coastline mapping and measurements. The art of fractals began to take shape in the 1980s with the visual representation of the calculations of fractals, using the increasing computing power of modern hardware and fractal calculating software. Fractal images, Julia and Mandelbrot Sets being two of the most recognized, are fascinatingly intricate, crystallizing years of research and theory in beautiful, “aesthetically pleasing” imagery.
Sources:
http://en.wikipedia.org/wiki/Mathematics_and_art
https://www.math.dartmouth.edu/~matc/math5.geometry/unit2/unit2.html
http://www-history.mcs.st-and.ac.uk/HistTopics/Art.html
http://plus.maths.org/content/artmathx
http://www.mathsisfun.com/numbers/golden-ratio.html
http://www.goldennumber.net/phi-pi-great-pyramid-egypt/
http://mathworld.wolfram.com/GoldenRatio.html
http://en.wikipedia.org/wiki/History_of_mathematics
http://candytale.hubpages.com/hub/Leonardo-Da-Vincis-Vitruvian-Man-Explained
https://www.youtube.com/watch?v=aMsaFP3kgqQ

Although the method had been eclipsed by other algorithms by then, it lasted at least in to the early 19th c, as shown in a German Copybook of a student from 1804 that I acquired. You can see it here http://pballew.blogspot.com/2013/10/division-some-notes-on-history-of.html
LikeLike